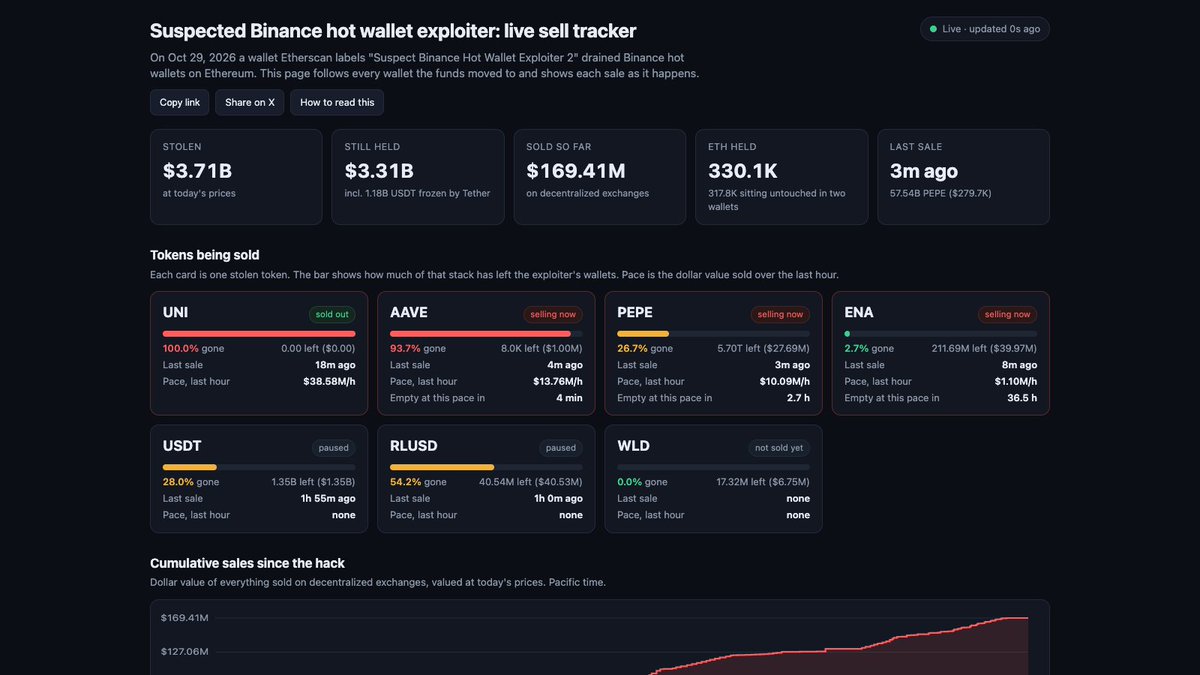
Suspected Binance hot wallet exploiter: live sell tracker
On Oct 29, 2026 a wallet Etherscan labels "Suspect Binance Hot Wallet Exploiter 2" drained Binance hot wallets on Ethereum. This page follows every wallet the funds moved to and shows each sale as it happens.
The story so far
Loading…
Where the stolen money is now
Every dollar taken, split by where it sits right now (today's prices).
Coins he still holds, and how much is already gone
The biggest piles left, which are the ones that could still be dumped. The orange part of each bar is what he has already sold or sent away.
His selling, hour by hour
Dollars of coins sold on exchanges each hour, Pacific time. Hover a bar for details.
Real-time feed
Streams straight from Ethereum: every token transfer out of a known exploiter wallet appears here within seconds of its block, before the tables below catch up. Red means the tokens left the exploiter's wallets (usually a sale); grey means a move between the exploiter's own wallets.
| Time (Pacific) | Token | USD | % of what was left | Still held | Hyperliquid | ||
|---|---|---|---|---|---|---|---|
| Connecting to Ethereum | |||||||
"The Binance exploiter is selling right now. Watch every trade live." One repost puts this tracker in front of everyone who follows you.
Tokens to watch
Stolen tokens still in play, ranked first by whether they trade on Hyperliquid, then by how big the exploiter's holding is compared to the coin's market cap. Sold out tokens and stablecoins are hidden. The bar shows how much of the stack has left the exploiter's wallets; pace is dollars sold in the last hour.
Stolen Bitcoin
About 18,270 BTC left a Binance hot wallet (bc1qm34l…7s3h) at 1:20 pm Pacific and landed at bc1q0mtc…2mnm, which split it up within minutes. Unlike USDT, Bitcoin can't be frozen. This follows every spend forward and rechecks each address about every 30 seconds. An address with lots of unrelated activity is treated as an exchange or service, where the trail usually ends.
| Address | BTC | USD | Status | |
|---|---|---|---|---|
| Loading Bitcoin data | ||||
Timeline
Everything that has happened since the hack, in order. Times are Pacific. Each lane is a coin and every sale is a dot (bigger dots are bigger sales); dashed amber lines are key moments. Hover or tap a dot for details, click to open it on Etherscan.
Comments
Say whatever you want. Anonymous, public, one comment every 30 seconds. Links and wallet addresses are blocked to keep "fund recovery" scammers out.
Sell pressure ranking
Tokens the exploiter still holds, ranked by the holding as a share of the coin's market cap. The Hyperliquid column shows the perpetual market, its open interest (OI), 24 hour volume and hourly funding. "Days of volume" is the holding divided by normal 24 hour trading volume: above 1 means one day of selling would equal a full day of the whole market's trading. Stablecoins and gold tokens are left out.
| Token | Exploiter holds | Sold so far | Share of market cap | Days of volume | Hyperliquid perp |
|---|
Cumulative sales since the hack
Dollar value of everything sold on decentralized exchanges, valued at today's prices. Pacific time.
Where the money went
Everything that has left the exploiter's known wallets, grouped by where it went. Wallets and contracts are checked live on Ethereum: a "new wallet" is an ordinary address with no public label, and "untouched" means it has never sent a single transaction. Exchange, bridge and mixer rows stay at zero until funds actually go there, which is usually the moment funds can get frozen or vanish. Valued at today's prices.
| Destination | Type | USD | Status now |
|---|
Every sale and transfer
Newest first. "% of what was left" is the sale as a share of what the exploiter held just before it. "% of original" is the share of the full stolen amount.
| When (Pacific) | What | Token | USD | % of what was left | ||||
|---|---|---|---|---|---|---|---|---|
| Loading | ||||||||
Every stolen token
Ranked by dollars still held. Frozen USDT counts as held.
| # | Token | Still held | Gone |
|---|
Exploiter wallets
Every wallet traced from the main exploiter address, ranked by ETH. Tokens worth $10K or more are listed; tokens that were not part of the theft are marked "(new)".
| Wallet | ETH | Tokens |
|---|
How to read this, and what it cannot see
- Sale means the exploiter sent a token into a decentralized exchange pool or aggregator (Uniswap, Curve, 1inch and similar). Sent out means it went to an address that is not a known exploiter wallet. Bridge means it left Ethereum.
- Gone is the share of a stolen token no longer sitting in any known exploiter wallet. It counts sales and transfers out. Funds sent to a wallet not yet traced also count as gone.
- ETH can show as negative because the exploiter swapped stolen stablecoins into ETH, so they now hold more ETH than they took.
- USDT: Tether froze the main wallet's USDT, so most of it cannot move. It still counts as held.
- Dollar values use current prices, not the price at the time of each sale.
- Ethereum only. Anything bridged to another chain drops out of view here.
Data comes from public Ethereum records via Blockscout and refreshes every minute or faster. Not affiliated with Binance. Not financial advice.